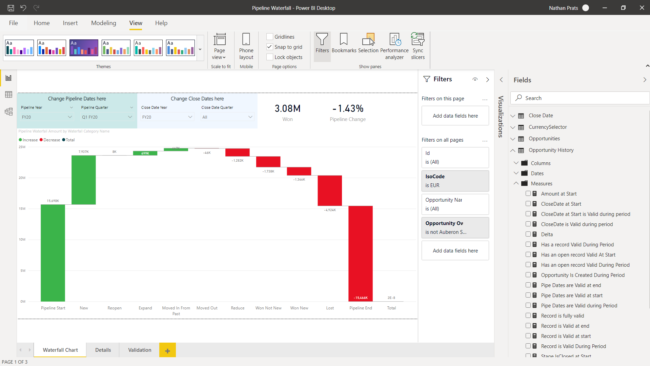
Building a Powerful Pipeline Waterfall Dashboard with Power BI: Unleashing Insights and Customization

Building a Powerful Pipeline Waterfall Dashboard with Power BI: Unleashing Insights and Customization The pipeline waterfall report is one of the advanced visuals the sales department can benefit from. Sales Operations often get access to this analysis through third-party forecasting software companies. However, it’s not uncommon to have data issues with this visual. In another…
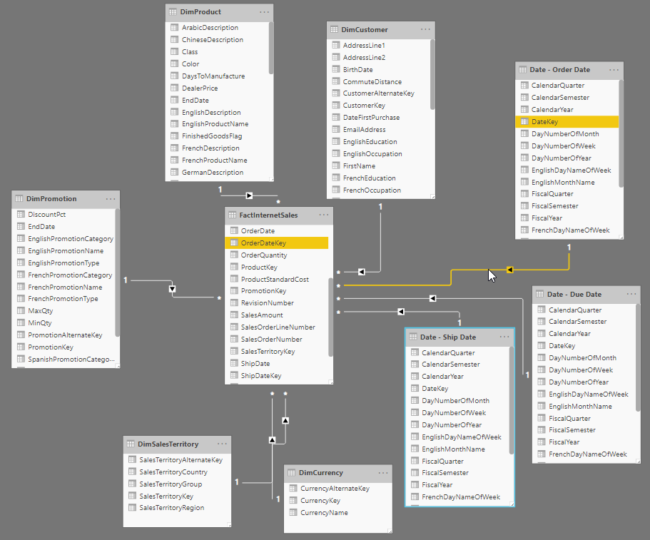
Choosing Between Single Date Table and Multiple Date Tables: A Guide for Data Modelers

As a data modeler, you need to understand the “one or many date tables” dilemma. You don’t want having to switch from one option to another after a few weeks of development, as it’d be a painful change to go through. In this post, I’ll try to give you a clear overview of these two…

Building Effective Hierarchy Structures in Power BI

Building Effective Hierarchy Structures in Power BI Organizational hierarchy or account mapping adds complexity to reporting. Being able to work with it with basic reporting tools like Salesforce report is impossible. For example, if your company sells to big customers with hundreds of subsidiaries, chances are that account mapping is quite important for your selling…