Revenue Operations
Welcome to my Revenue Operations blog, where I organized articles in the 3 essential pillars of Revenue Operations:
- Strategy – We explore innovative approaches and frameworks to align your revenue-generating teams, ensuring cohesive and strategic growth.
- Insights – Data-driven decision-making is at the heart of success. Discover the latest trends, analytics, and actionable insights that will drive your business forward.
- Systems – Streamline your operations with the best tools and processes designed to enhance productivity and drive revenue.
Leveraging Lightning Usage Metrics for Change Management Change management is one of the main key success factors in any Salesforce project. How do you track adoption? How do you ensure that Salesforce users follow your new process? In this blog post, I’ll show how to query the “LightningUsageByPageMetrics” object to get some insights about user…
Details
Organize your Trailhead Superbadges with GitHub and Salesforce DX Trailhead Superbadges are great to apply what you’ve learned in real business cases. However, there is no easy way to retake these Superbadges for now. If you wanted to, you would have to create a new Trailhead account and complete all Superbadges pre-requisites… which is not…
Details
Efficiently Designing Sales Territories with Salesforce Territory Management 2.0 Why designing sales territories? There are many ways to design sales territories within Salesforce. In small companies, sales representatives have a list of accounts they own, and own the opportunities related to these accounts. This list can be updated by the sales director each quarter. Ownership…
Details
Optimizing Sales Processes: Best Practices for Data-Driven Decision Making Sales process is the cornerstone of any healthy pipeline. Everyone in your company should understand it, follow it, and use it to make data-driven decisions. In this post, I’ll share some best practices around sales processes. The importance of the sales process Your sales & marketing…
Details
Best Practices for Salesforce Data Migration Salesforce data migration projects can be a hassle if you don’t have any best practices to follow. I recently had to split an object into 2 objects as we were storing information of 2 separate “elements” into 1 object. This kind of architectural mistake causes many issues. Namely, fields…
Details
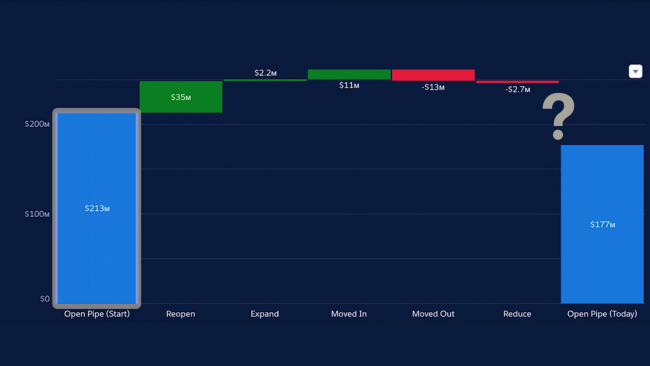
When the Waterfall just doesn’t line up right Pipeline waterfall charts are great to analyze your pipeline. Recently, Salesforce launched Einstein Analytics, and it comes with these amazing charts. However, some Salesforce Orgs will face some “bugs” with these charts. Bars on these charts won’t even out, and the following equation can be false: Open…
Details
Efficient Salesforce Report Management Using Eclipse & Notepad++ Salesforce management of reports can be tedious. The main reason why is that you can’t update or create reports via the Data Loader. Thought the Salesforce UI, simple tasks such as moving 200 reports from one folder to another or modifying a filter to 200 reports can…
Details
Mastering Pipeline Management: Key Metrics for Predictable Revenue Pipeline management is the key to generate predictable revenue. KPIs like win rate, pipeline coverage, and Mario charts can provide significant insights on pipeline management. Let’s say your 10 sales reps team has to close 10M€ per year. On average, they win 1 opportunity out of 4.…
Details
Streamlining Sales Territory Management in Salesforce Territories benefits remain a bit gloomy for many people. In this post, I’ll explain why developing and maintaining sales territories in Salesforce is essential. Territory implementation means assigning one or many users for each account. Thus, having a table with “accounts” in column A and account owners in column…
Details
Storytelling with Data: Creating Impactful Dashboards Analysts build so many reports and dashboards that it gradually becomes impossible for the management team to focus on the primary key performance indicators – or KPIs. Together, they should choose the KPIs that they want to track on a daily, weekly or monthly basis. Let’s say the business…
Details
